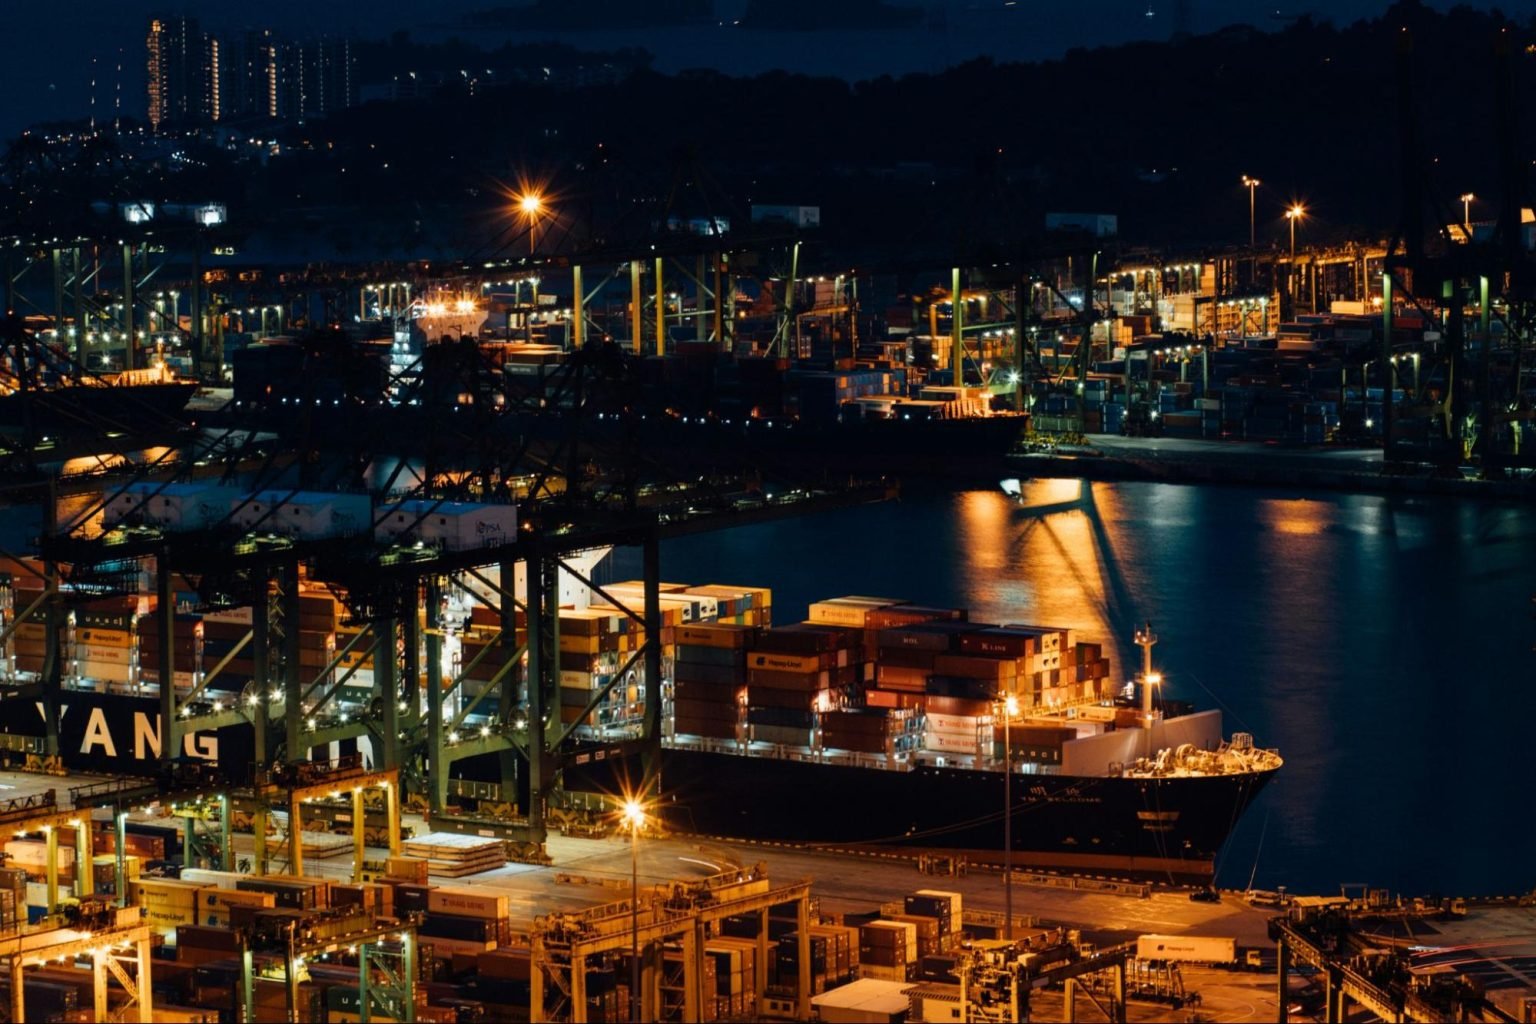
Picture by Hanson Lu for Unsplash
June 6, 2024
In recent weeks, the Port of Singapore has grown into a logistical nightmare. A problem that is likely to spread to the rest of Asia.
Last week, wait times at the port reached up to seven days for vessels to dock and depart from Singapore. Such wait times are unusual at Singapore which, as of 2021, was the second largest port in the world, handling over 37.49 million TEUs of cargo, and, in 2023, held the title for the 17th most efficient port in the world. For context, that is more than half of the entire number of containers handled in North America that same year with only one port (Lázrao Cárdenas) entering the top 50 in terms of efficiency.
TEUs Handled by Top 10 Ports in the World (2021)
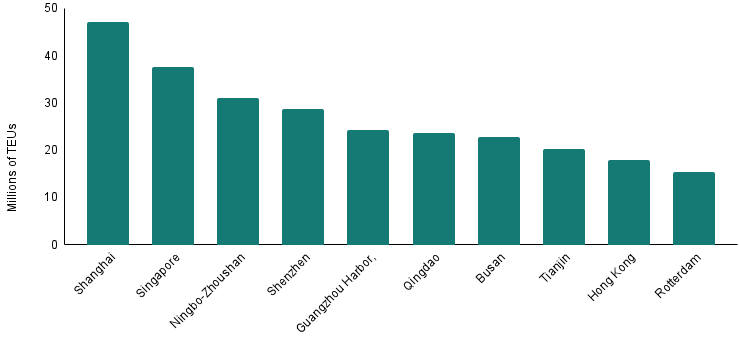
(Data from World Shipping Council)
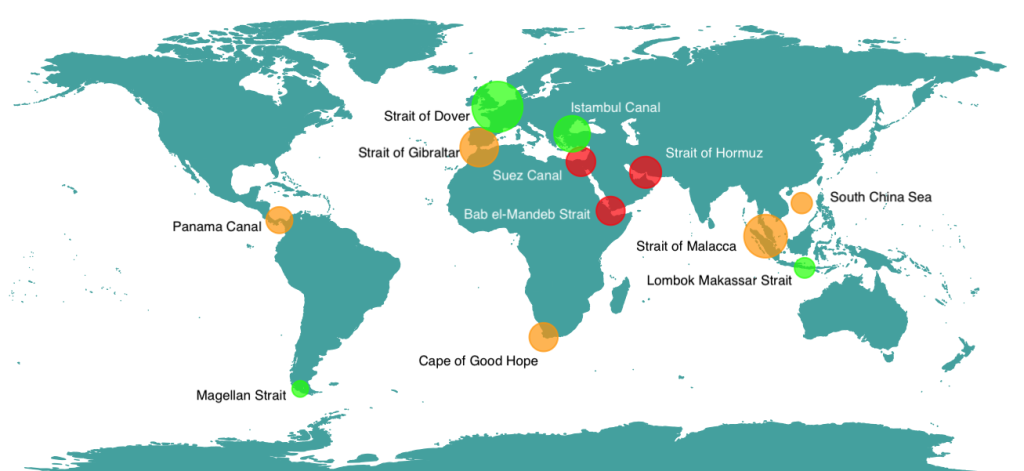
The impact from these conditions is further aggravated by the dynamics of the Port of SIngapore. While other large ports such as Shanghai, Ningbo, Shenzhen serve as strategic entry or end point to cargo, Singapore is mostly a transshipment port. That is, the vast majority of vessels use Singapore as a strategic stop between Asia and the Indian Ocean—a place to refuel and change containers to other vessels headed to plethora of regions. This, in great part, is due to the geography of Singapore which is in close proximity to the Strait of Malacca—a crucial artery to global trade accounting for some 18% of global traffic along key maritime choke points. Before vessels depart to various destinations in the rest of Asia, Oceania, or Europe, Singapore is the natural resting point. In fact, as of 2021, Singapore was the busiest transhipment port in the world serving more as a middle point to carriers than an actual end to commerce.
However, by serving as a middle point to so many trade routes, congestion at the port of Singapore naturally results in delays for dozens of vessels. At the time of writing, Singapore has reached a point where there are more vessels waiting to dock in the port than those actually in the port’s facilities. While there are currently 331,231.5 TEUs being handled in the dock, there are another 367,9685 TEUs waiting to enter the port. This means that, at Singapore, there are 1.1 times more containers stuck in congestion than those being served by the port despite the port’s maximum capacity of 450,000 TEUs.
Distribution of TEUs Handled at Singapore
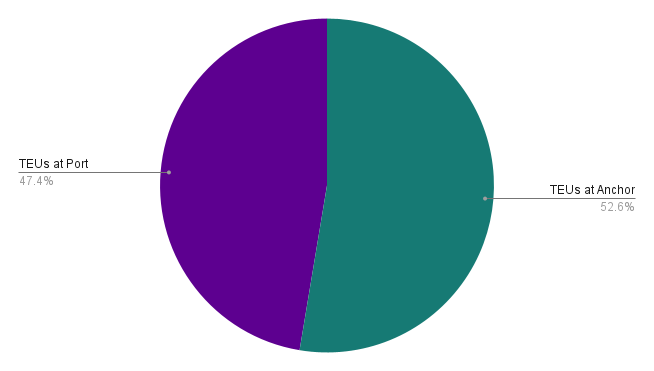
(Data from Linerlytica)
The disruption caused by this increase in congestion is such that over half of all Asian shipments to Europe in the past week departed with delays. In fact, even with large disruptions elsewhere in the world, it is currently estimated that South East Asia accounts for 26% of all port congestions, while North East Asia accounts for an additional 23%.
There are at least two main explanations for the increased wait times at Singapore. On the one hand, Houthi rebels continue to disrupt trade in the Red Sea by attacking vessels headed to Israel and, by extension, the Suez Canal. This has resulted in major tensions as shipping companies reroute through the Cape of Good Hope. Those disruptions, in turn, have increased wait times in Singapore as carriers determine the best path to follow.
On the other hand, Chinese producers are said to be rushing orders before a new set of US sanctions severely diminishes their potential sales. At Auba, we estimated that such tariffs would impact upwards of $13.5 bn worth of trade goods.
Although Singapore’s port authority recently announced an increase in capacity by opening older berths, congestions continue to be a prevalent issue. A problem that, quite likely, will continue in months to come if Houthis continue to disrupt trade and US-China tensions result in increased tariffs. All of this, in turn, adds one further choke point to the world of international trade which we, at Auba, include in our official map of Choke Points by changing our categorization for the region surrounding the Strait of Malacca from green (no disruption) to orange (mild disruption).
Auba Map of Choke Points