
April 30, 2024
We are living through an era of trade disruptions.
Perhaps, nowhere is it clearer than looking at the Mediterranean Sea today. In recent months, storage capacity at Mediterranean ports has reached a record level of saturation. Ports like Barcelona are reporting as much as a 17.2% year to year increase in TEU activity, as more boats are entering the Strait of Gibraltar full of imports. This, in turn, has pushed companies to use smaller container ships, known as feeders, to serve the rest of the Mediterranean, although most of the feeder fleet in the region is severely outdated with an average age of 26 years. further saturating other ports across the sea.
This recent congestion at Gibraltar is actually the result of actions taking place over 5,500 km away, and demonstrates just how interconnected the world of maritime trade really is.
Even though 80% of global trade takes place at sea, this doesn’t mean that container ships are traversing the entire ocean. In fact, we’ve found that the vast majority of global trade is concentrated in just 12 crucial points. Currently, it is estimated that the global merchant fleet contains little over 103,000 vessels which traverse the oceans multiple times every year. There is no reliable database on the actual number of trips made by all vessels at sea. However, we found evidence that these 12 choke points account for 497,700 thousand trips per year—or, being traversed by every ship in the world almost five times a year.
The ports in question are the Dover Strait, Malacca Strait, Gibraltar Strait, Istanbul Strait, South China Sea, Hormuz Strait, Suez Canal, Bab-el Mandeb Strait, Cape of Good Hope, Panama Canal, and Strait of Magellan. Put together, almost every vessel in the world is set to traverse one of these points at least once in their lifetime. For commercial vessels such as container or cargo ships, they might cross them multiple times a year.
Number of Vessels per Year at Crucial Trade Intersections
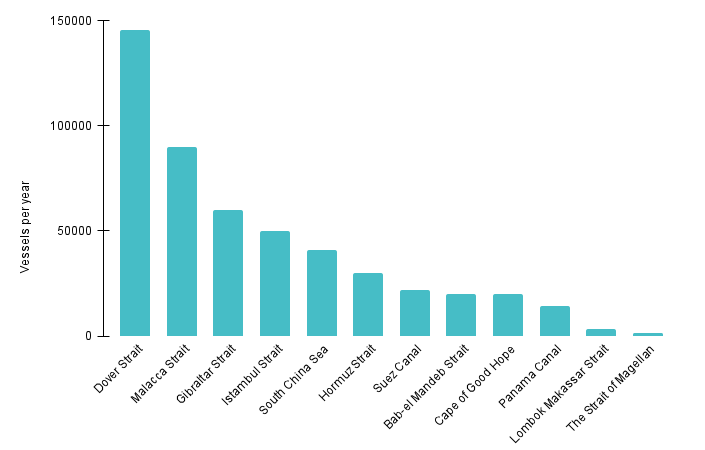
(Data from Auba Research)
Given how concentrated maritime trade is amongst these routes, they also become natural choke points to seaborne trade. If, for instance, a blockage were to occur on the Dover Strait—by far the most active trade route in our dataset—it would disrupt the flow of as many as 145,000 vessels a year—or some 400 vessels per day of disruption. The same is true for the other 11 points in the dataset. A disruption to any of these would force a considerable share of global trade to find new routes to deliver goods to their end destinations.
In fact, most of the news about trade disruptions in the press today are related in some form or another to these choke points. At Auba, we wanted to go further into understanding these areas of interest and decided to categorize them based on the level of disruptions experienced in each of them. Below, we include the first Auba Maritime Choke Point Map which we intend to update periodically as new trade disruptions emerge.
Auba Maritime Choke Point Map
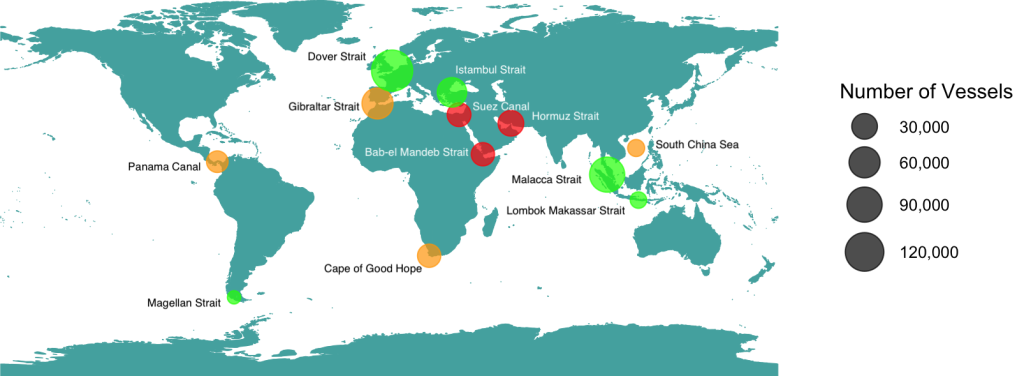
(Data from Auba Research)
The Auba Maritime Choke Points Map effectively displays the 12 most prominent choke points to global trade with different circles that represent the number of vessels traversing the area per year. We also decided to color code each point based on the level of disruptions currently experienced. In green, we included areas with no major disruptions including the Magellan Strait, Malacca Strait, Istanbul Strait, Dover Strait, and Lombok Makassar Strait. In orange, we included choke points where there is currently a minor disruption. These include droughts in the Panama Canal, China’s growing military presence in the South China Sea, and increased flows of goods in the Cape of Good Hope and Gibraltar Strait.
Finally, in red, we included choke points where an event has completely or almost completely blocked global trade. Such is currently the case of the Bab-el Mandeb Strait, Suez Canal, and Hormuz Strait—albeit this latter choke point is impacted by a lesser degree. Starting in December of last year, Houthi rebels began attacking vessels entering the Bab-el Mandeb Strait in a sign of solidarity to Palestine during the war with Israel. This, in turn, has cut flows to the Suez Canal and deterred global commerce away from the Red Sea as a whole.
This brings us back to our original discussion about the Gibraltar Strait. After Houthi attacks began across the Red Sea, global companies began to seek alternatives to reach the European market. The only route available was to redirect vessels to the Cape of Good Hope and, in thereafter, reach the Gibraltar Strait, thus increasing traffic in both points—and justifying the orange color in the Auba Maritime Choke Point Map.
Above all, we at Auba want to bring awareness to just how interconnected the world of trade truly is. The rise of trade in the Mediterranean sea is one example of many that are likely to emerge. In coming Alerts, we will update our Maritime Choke Points Map to properly reflect the reality of global supply chains.
